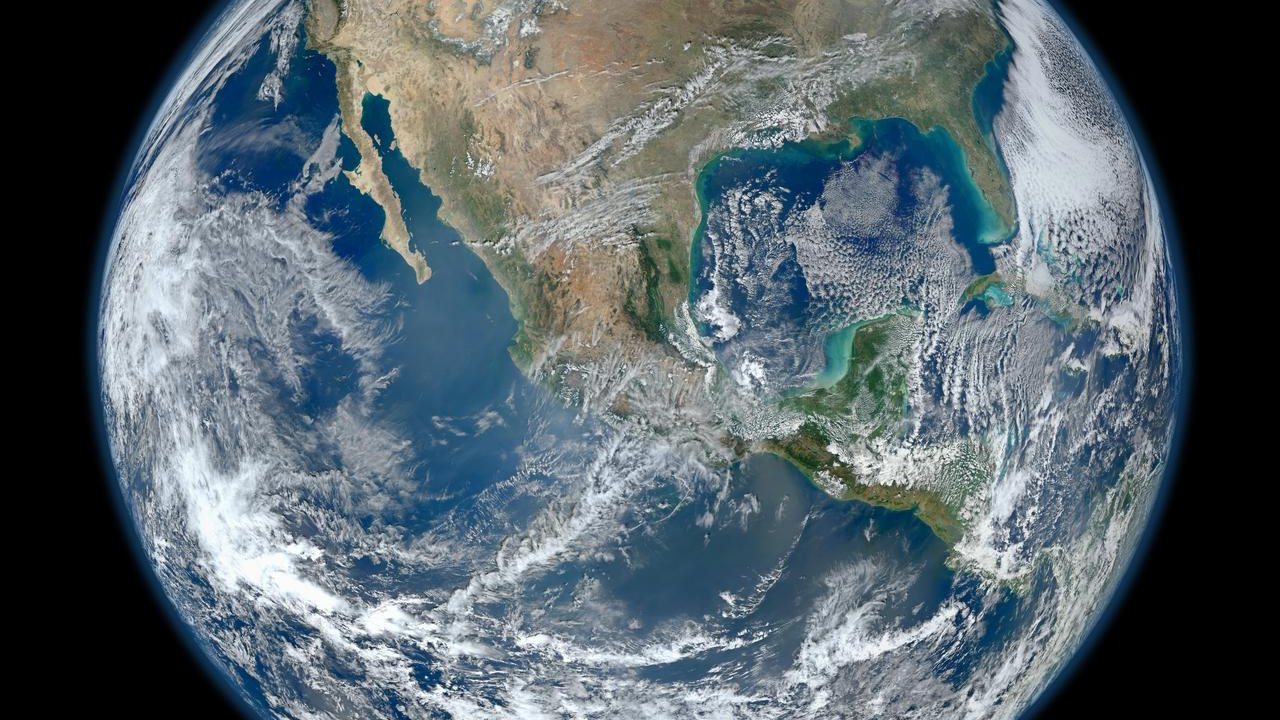
CHICAGO - Weather is what a place is doing today. Climate is what a place tends to do over time. The distinction sounds simple, and in essence it is, but keeping it straight under the pressure of a heat wave, a cold snap, or a single ferocious storm turns out to be one of the harder disciplines in public reasoning about the natural world.

A single day's temperature, however extreme, is a data point, not a trend. Climate is conventionally described using averages computed over a period of decades, often thirty years by long-standing convention, long enough that the ordinary year-to-year swings of weather, warm winters, cool summers, wet spells, droughts, mostly cancel out, leaving a clearer picture of the underlying pattern. Neither an unusually hot month nor an unusually cold one, taken alone, says much about that longer pattern in either direction.
Baselines and Normals
To make sense of any single reading, scientists and forecasters compare it against a baseline, often called a "normal," itself an average calculated over a fixed reference period. A day described as warmer or cooler than normal is being measured against that multi-decade average, not against the same date in the previous year. Choosing a different baseline period can shift the comparison somewhat, which is one reason careful reporting specifies what baseline is being used rather than leaving the comparison to guesswork. The normal itself is a technical convention rather than a judgment about what weather ought to feel typical, and it is updated periodically as the reference period moves forward, so a normal calculated today will differ somewhat from one calculated a generation earlier.
Longer-term records rest on two broad kinds of evidence. Direct instrument records, from thermometers, rain gauges, satellites, and buoys, offer precise, continuous measurement but generally cover a shorter span of history in most places. Proxy records, evidence such as tree rings, ice cores, and sediment layers that preserve some physical trace of past conditions, extend the view much further back in time, at the cost of coarser resolution and wider uncertainty. Neither type of record is read alone. Confidence in any conclusion about the past generally grows when independent proxies and instrument records point in the same direction. Direct instrument coverage, once sparse across oceans and remote regions, also expanded considerably over time as stations, ships, and eventually satellites filled in the map, which is one reason recent, well-covered periods generally support firmer comparisons than periods reconstructed largely from proxies.
Signal, Noise, and the Temptation of a Short Span
Any long record contains both a signal, the underlying trend, and noise, the natural variability layered on top of it. The central skill in reading such data honestly is not mistaking one for the other. Natural cycles, ocean patterns, volcanic activity, and simple random variation all add noise that can temporarily mask, mimic, or exaggerate an underlying trend over any short stretch of years.
This is exactly the terrain where a trend line can mislead, whether by accident or by design. Selecting a start date that happens to fall on an unusually warm or unusually cool year can make an ordinary trend look dramatically steeper, flatter, or even reversed, a practice generally described as cherry-picking. The remedy is not complicated, if not always convenient: examine the longest reliable record available, note the size of the natural year-to-year variation, and be wary of any conclusion built on a span too short to distinguish a genuine trend from ordinary noise.
A related habit worth borrowing from statistics is attention to the base rate, the ordinary background frequency of an event before any particular instance of it is considered. A single severe storm, flood, or heat wave prompts an understandable question: is this becoming more common? Answering it responsibly means comparing the recent frequency of such events against their historical base rate over a long record, rather than reasoning from the vividness of the most recent example alone. Memory is a poor substitute for a record, since recent and dramatic events tend to loom larger in recollection than their actual frequency warrants.
None of this requires any particular conclusion about what ought to be done about a changing climate, a question of policy and values on which reasonable people disagree. It requires only a small set of habits: distinguishing a single day from a long average, asking what baseline a comparison uses, checking whether a trend survives being measured over a longer span, and treating any one event, however striking, as a single data point rather than a verdict.
For local service context, see Marketingbymagnet.