
WASHINGTON - Every month, and again every quarter, a fresh batch of economic statistics arrives in the capital, and with it a familiar temptation: to read a single number as a verdict on the state of the nation. The temptation is worth resisting. The economy is not one instrument playing one note, but an orchestra, in which growth, prices, employment, and borrowing costs each keep their own time. Reading the country's economic condition well means following several instruments at once, and accepting that they will not always agree.
Growth, and the Difference Between a Level and a Change
The broadest gauge of the economy is gross domestic product, the total value of goods and services produced within the country over a given period. Economists tend to describe this figure not by its size, a level, but by how quickly it is changing, a rate. A large economy growing slowly and a smaller one growing quickly can both be called healthy, depending on which measure is in view. Confusing the two, a pause in growth for a decline in output, is among the most common errors in reading economic news.
Growth figures are also estimates, assembled from surveys and records that arrive on a delay. The first published reading for any period is routinely revised as fuller data comes in later. A revision is not evidence that statisticians erred. It shows them refining an early sketch into a more accurate portrait as better information arrives.
Inflation, in ordinary usage, refers to the rate at which the general price level is rising, not the price level itself. A grocery bill higher than it was several years ago reflects the level; the inflation rate describes how quickly that level is currently moving. When the inflation rate falls, prices are not necessarily falling with it. More often, they are still rising, only more slowly than before, a distinction frequently lost in casual conversation.
Price measures also vary by what they include. Some strip out food and energy costs, which swing sharply for reasons often unrelated to the broader economy, to see an underlying trend more clearly. Households experience inflation through the specific goods and services they buy, which is why a national average can feel disconnected from a family's own budget. A renter with a long commute and a large household to feed will experience price changes differently than a retiree with a paid mortgage and modest transportation costs, though both are described by the same national figures.

The labor market is usually described through a handful of figures that move somewhat independently: the unemployment rate, the pace of hiring, wage levels, and the number of job openings employers report. A labor market can add jobs while the unemployment rate ticks upward, if enough new job seekers enter the workforce at once. Wages can rise even as hiring slows, if employers competing for fewer workers pay more to keep them. None of these figures alone captures the labor market's condition; together they offer a fuller picture than any single line can provide.
Spending, Borrowing Costs, and the Central Bank
Consumer spending makes up a large share of national economic activity, which is why retail figures and surveys of household sentiment draw close attention. Spending tends to hold up as long as households remain employed and confident in their income, even when those same households voice worry about the broader economy in surveys. That gap, between what people say and what they do, is itself a useful signal, though not always an easy one to interpret.
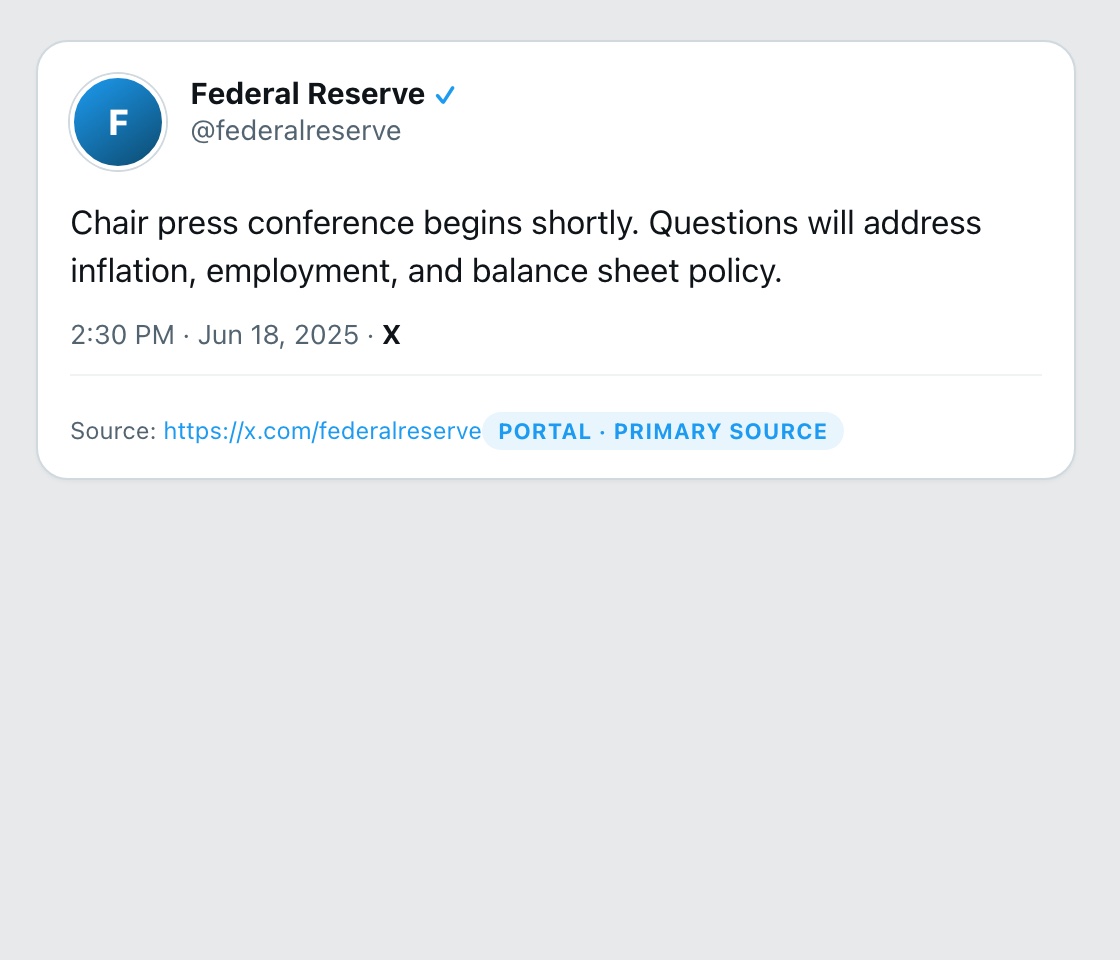
Interest rates set by the nation's central bank, the Federal Reserve, influence borrowing costs throughout the economy, from mortgages to business loans to credit cards. The central bank adjusts its policy rate to keep prices stable and employment strong, but the effects of any rate change reach the broader economy only gradually, often over many months. This lag is why the central bank is often described as steering a large ship, whose turns show their full effect only much later.
Economists commonly sort indicators into two families. Leading indicators, such as building permits or new manufacturing orders, tend to shift before the broader economy does, offering an early hint of what may follow. Lagging indicators, such as the unemployment rate, tend to confirm a turn only after it has occurred. Reading both together guards against overreacting to a single leading signal, or dismissing a shift already underway beneath the headline numbers.
A single month of data, whatever it shows, is more often noise than signal. Monthly figures are volatile by nature, subject to revision, and sensitive to one time events such as severe weather. A trend sustained across several months or quarters carries far more information than any one reading, however dramatic it might appear in isolation.
None of this argues for indifference to economic news. It argues for patience: for waiting on a trend rather than a headline, for keeping level and rate of change distinct, and for remembering that a national average describes no single household precisely. Read that way, the economy's signals, however varied their tempo, become easier to follow and far less cause for alarm.
For local service context, see Ownersfirm.